Tampilkan postingan dengan label GeoTools. Tampilkan semua postingan

Senin, 02 April 2012

Saving the world one application at a time: Atlas of Tuna and Billfish Catches

This blog post covers some work we have done to support the FAO Fishery and Acqualture Department, specifically the FIGIS group with information dissemination about catches of Tuna and Billfish over the last 60 years globally

As stated on their website:
"... the Atlas presents the global distribution of catches by gear from 1950 to 2010, at 5° latitude by 5° longitude resolution, of those tuna and tuna-like species for which this distribution is generally well known on the global scale. These species consist of the so-called principal market tunas and some billfishes."

Atlas of Tuna and Billfish catches website


Using Geoserver, OpenLayers and Ext-JSwe built for them a simplfied viewer that allow users to access dynamically their statistics and to map them by multiple dimensions:

  • by gears (one or more)
  • by species (one or more)
  • for a certain years' range
  • for a certain quarters' range
Moreover users can decide to view the following indicators:
  • Cumulative catches across years
  • Average catches across years 
  • Average catches across quarters
The selections made by users are reflected directly on the visualization combining data from various sources through the GeoServer; animations can be created across years as well as years' quarters to show the evolution of the catches. The result can be seen here and in the pictures below.


Let's take a look at the implementation.
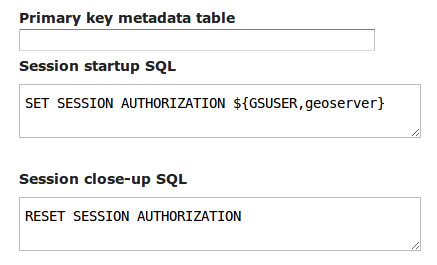
Background maps are served via GeoWebCache, nothing too sophisticated there, while the maps are generated on the fly by GeoServer connected to the FAO corporate Oracle instance via SQL Views that are performing join and aggregations on the fly between tables containing live information about catches and tables containing ancillary information like species and gear types. In addition, users can print the current map (together with the eventual result of a request for info on the map), as shown here below,


or they can request to generate an animated GIF, leveraging on the WMS Animator work (see this page for additional info) using a specific panel shown below where multiple dimensions can be again controlled:


Here below the resulting animations is shown.


Let us now summarise a few points for this project:
  • background maps are served with GeoWebCache which is shared with all the others mapping applications in places withing the department
  • most of the data is stored inside the corporate instance of Oracle Spatial, demonstrating perfect integration of Open Source with COTS
  • extensive usage of CQL filters and SQL Parametric Views has been made to generate dynamic maps and animations
Last but not least, we believe it is worth to mention that this work was performed via our GeoSolutions Enterprise ServicesTherefore, if you'd like to know more about what we could achieve together, do not hesitate and get in touch with us!

The GeoSolutions team,

Senin, 26 Maret 2012

Developer's Corner: Authenticating dummy clients in GeoServer

In this blog post we'll introduce a simple authentication method we developed for GeoServer that allows to deal with security unaware clients.

GeoServer can be configured to force a user to authenticate, either directly when trying to access the capabilities document (challenge mode) or when trying to access a protected resource (mixed mode). GeoServer will send a "http basic authentication" challenge, that will force browsers to show up the "username/password" authentication dialog, and make other desktop application ask and send over the user credentials.

There are surely more secure means to authenticate a user, yet basic http authentication is the minimum common denominator, something that most clients support, and coupled with HTTPS transport it provides a good starting point for a secured site.

Unfortunately there are clients out there that cannot even deal with basic authentication.
Some of the existing solutions deal with this by making you install a little desktop proxy software that the other software can connect to, with the proxy dealing with all security considerations. That is fine when you are in control of the client side, but not practical when the user is not able, willing, or allowed to install extra software on their machine.

To allow for some level of authentication and security in those cases we developed a community module called "authkey", or "Key authentication module", where all that is requested to the client is to add a unique key indentifying the user into the capabilities request.
Something like:
http://myhost/geoserver/wms?service=WMS&request=GetCapabilities&authkey=ef18d7e7-963b-470f-9230-c7f9de166888
And voilà, the user associated to that code will be recognized. The capabilities document returned will also contain back links to GeoServer that replicate the same code, so that also GetMap and GetFeatureInfo requests will work under that same user.
This way the authentication is done without the software having to willingly participate in the authentication mechanism.

The default implementation of the module will look for a property file that configures the associations between the unique codes and the existing users, but different solutions can be plugged in that allow for authentication via hardware code tokens, or daily tokens, or whatever solution you might come up with: see the documentation for more details on the configuration and instructions on how to write your own plugin.

Of course the solution is simple, but coupled with HTTPS it's more or less as secure as using basic authentication, and allows a wider range of client software solutions to participate in the game.

What about you, looking for some missing GeoServer security features? Interested in knowing more about our Enterprise Services? Let us know!

The GeoSolutions team,

Selasa, 20 Maret 2012

Saving the world one application at a time: FAO Regional Fishery Bodies Viewer

At GeoSolutions we believe that success stories about important organizations and Open Source Software should be openly shared and they can be used as a measure of OSS success in the formal enterprise environment.  In this blog post we are going to quickly introduce some work we have done for the Fishery and Acqualture Department of the Food and Agriculture Organization (FAO) of the United Nations (UN).

The FAO Fishery and Acqualture Department, specifically the FIGIS group; is involved in many efforts geared towards the conservation of the marine ecosystem and GeoSolutions is honored to work with them on some of the mapping applications they need in order to create effective querying and visualizations of the data they manage.

This blog post covers some work we have done to support information dissemination about Regional Fishery Bodies (RFB). As stated on their website:
"Regional Fishery Bodies (RFB) -- a group of States or organizations that are parties to an international fishery arrangement -- work together towards the conservation and management of fish stocks.
RFB can play a critical role in promoting longterm sustainable fisheries where international cooperation is required in conservation and management."


Using Geoserver and OpenLayers we built with them a comprehensive web based API to create on the fly maps with the relevant information for each resource with just a couple of lines of Javascript code. Maps are embedded in the FIGIS portal, as can be seen here and in the pictures below,


but also a specific RFB Viewer can be used to quickly show the RFBs' coverage on a map as shown at this link and in the screenshot below.


Let's take a deeper look at the implementation.
Interacting with GeoServer's WMS module we dynamically build the map with the continental layer, the member countries, the coast lines and the fishery boundaries. The API supports 3 different projections: WGS84 (EPSG:4326), Google Mercator (EPSG:900913) and Polar Stereographic (EPSG:3031).
For each of the regional fisheries body selected in first drop down menu, we generate an embed code as pictured below, this is used by the Fishery department web designers to replace what previously were static images representing the resources distribution and limits. It could also be used by an external website to embed these maps into their site.


More could be said about this project regarding its infrastructure, let's summarise a few interesting points:
  • background maps are served with GeoWebCache
  • most of the data is stored inside the corporate instance of Oracle Spatial, demonstrating perfect integration of Open Source with COTS
  • Extensive usage of CQL filters to drive the dynamic maps is used
Last but not least, we believe it is worth to mention that this work was performed via our GeoSolutions Enterprise Service. Therefore, if you'd like to know more about what we could achieve together, do not hesitate and get in touch with us!

The GeoSolutions team,

Rabu, 29 Februari 2012

Articolo di GeoSolutions su GeoServer ad ASITA 2011

Salve a tutti,
con colpevole ritardo, mettiamo a disposizione dei nostri lettori l'articolo presentato alla conferenza ASITA dell'anno scorso.
Una versione in pdf può essere scaricata qui.

The GeoSolutions team,

Senin, 30 Januari 2012

Developer's Corner: Introducing Database Level Security in GeoServer

During our work we support manu GeoServer Enterprise installations which pull data from a spatial database of some sort, normally via a connection pool, a tool that keeps database connections around so that we don't have to open and close them at every request (something that could be very expensive).
The pool accesses the database via a shared user, that all GeoServer requests end up using. Some requests only require data reading (WMS GetMap), others modify data (WFS Transaction), some even create new tables (RESTConfig data uploading for example).
The pool user must be able to perform all and any of the operations that GeoServer needs, meaning that more often than not it has very wide powers of what it can do on the database.

GeoServer built in security, as well as extensions such as GeoRepository, allow to control what specific users can do and shield the database from security issues.
However in some enviroment the preferred security management policy is to have security restrictions operate at the database level instead, with the pool user being given minimal rights (normally, to list and describe the tables, but without any actual access to them). This has some advantages:
  • the security is setup just once for the variety of applications that might access the database
  • each user can actually perform only the operations that he/she was allowed to, regardless of eventual bugs/security holes in the application level software
  • leverages the DBA expertise
GeoSolutions recently implemented the ability to use DBMS session startup and teardown scripts that can be used to alter the user accessing the database for the duration of the current request, turning back to the pool user when the request is complete.
These commands can be specified in the configuration User Interface while setting up the data store. For example, if we wanted to have each and every PostgreSQL session use the credentials of the current GeoServer user we'd use the following setup:

Different databases will of course use different commands, or custom, in house package calls, to setup the current session user. See the GeoServer documentation for more details on how this new functionality can be used.

We'd like to thank Astrium GEO-Information Services for sponsoring this improvement and sharing it with the GeoServer and GeoTools communities.

Application security is certainly one of the topics we like to deal with. There is of course a lot more to explore and improve, this topic is both rich and interesting. Want for example CAS or Shibboleth security in your GeoServer intallation? Maybe integration with Active Directory? Talk to us first!

The GeoSolutions team,

Rabu, 30 November 2011

GeoServer and GeoSolutions @ gvSIG Days 2011

GeoSolutions will attend the 5th edition of the gvSIG Conference, organized by the Regional Ministry of Infrastructure and Transport (CIT) from December 2nd until December 4th at the Feria Valencia Convention and Exhibition Center.  


Ing. Simone Giannecchini will provide an introductive workshop on GeoServer, therefore make sure you take note of the exact time on the conference program and you make room in your schedule for attending the event.
Check this link for more details.

See you in Valencia!

The GeoSolutions team.


Selasa, 22 November 2011

GeoServer e GeoSolutions al GFOSS Day 2011

GeoSolutions sarà presente alla conferenza GFOSS DAY 2011 che si terrà a Foggia il 24 e 25 Novembre presso la Università degli Studi.


Oltre ad essere sponsor Silver della manifestazione, GeoSolutions sarà presente con un workshop gratuito introduttivo ed una presentazione su GeoServer che si terranno entrambi nella giornata del 25 (si veda per dettagli il programma della manifestazione).

Quindi, se volete essere aggiornati sugli sviluppi del GeoServer o se volete essere introdotti al suo utilizzo da uno dei suoi creatori non vi resta che farci visita a Foggia!

The GeoSolutions team.


Kamis, 03 November 2011

ImageI/O-Ext 1.1.2 Released


Dear all,
GeoSolutions is pleased to announce the ImageI/O-Ext 1.1.2 release. With respect to 1.1.1, it adds a few bug fixes as well as improvements for the Tiff reader as well as on how we manage file memory mapping to provide a nice performance boost on remotely mounted file systems, e.g. NFS.
Release artifacts have been deployed on the GeoSolutions maven repository, as well as on the OSGEO one.

It is worth to notice that we are right now discussing with the GeoServer community for switching the GeoServer 2.1.x branch to this new ImageI/O-Ext release (the unstable trunk version already leverages on this newest ImageI/O-Ext) .

If you have questions about ImageI/O-Ext or if you want to know more about our services could help your organization to reach its goals, do not hesitate to contact us.

Regards,
the GeoSolutions Team

Senin, 12 September 2011

GeoSolutions Talks @ FOSS4G 2011


Dear All,
it looks like we will have some busy times at FOSS4G this week.
If you check this search you can see a few interesting talks that we will give, let's group them by topic:

GeoServer
GeoTools

It is worth to point out that Wednesday there will be a full immersion on GeoServer with 3 talks in a row that will go from a general overview of the project to an in-depth analysis of rendering and production set up.

Are you curious to know more about the latest developments we have done? Interested in knowing how we can help your organization reach your goals? Contact us!

The GeoSolutions team,

Senin, 04 Juli 2011

GeoSolutions @ FOSS4G 2011


Dear All,
it looks like we will have some busy times at FOSS4G this year.
If you check the schedule here you can see a few interesting talks that we will give, let's group them by topic:

GeoServer
GeoTools
JAITools

Well, it is encouraging to see that people are interested in what we are doing, all the effort we put into doing Open Source software is producing value for the larger community.

Are you curious to know more about the latest developments we have done? Interested in knowing how we can help your organization reach your goals? Contact us!

The GeoSolutions team,

Selasa, 19 April 2011

ImageI/O-Ext 1.1-RC1 Released


Dear all,
GeoSolutions is pleased to announce the ImageI/O-Ext 1.1-RC1 release which has been incubating for a long time.
Changes with respect to 1.0.x series can be summarised as follows:
  • Out-of-the-box Support for GDAL 1.7.3, which means no more patches are needed for GDAL Java bindings in order to access it from ImageI/O-Ext.
  • BigTiff support, breaking the 4GB TIFF limit.
  • EnhancedImageReadParam support. It extends the standard ImageReadParam by implementing Cloneable (used when supporting MultiThreading read operation) and a new DestinationRegion param to support oversampling/subsampling without specifying sourceSubSampling parameters. This may be used when dealing with readers which internally take care of performing subSampling/overSampling, such as the GDALImageReader
  • Experimental multidimension plugin for reading spatiotemporal sources like:
    • netCDF raster files following the Climate and Forecast (CF) convention
    • GriB edition 1
    • HDF version 4
Release artifacts have been deployed on the GeoSolutions maven repository, as well as on the OSGEO one.

Regards,
the GeoSolutions Team

Senin, 07 Maret 2011

Developer's corner: adding two global equal area projections to GeoTools/GeoServer

Recently we had the pleasure to implement two new map projections for GeoTools/Geoserver: the Eckert IV projection, and the Mollweide projection.

Both projections happen to be equal area projections.
These projections are commonly used in atlases to represent the whole world, as they don't alter the relative proportions of countries and continents.

This is actually an important feature missing from the common Google/Bing/Yahoo maps. They are all using a close relative of the Mercator projection, which greatly exaggerates the size of all countries at high latitude (for example, Greenland and Antarctica look a lot bigger than they actually are).

Compare that with Eckert IV, obtained calling GeoServer with the map reflector:
http://localhost:8080/geoserver/wms/reflect?layers=countries&srs=EPSG:54012


And here is Mollweide, obtained calling http://localhost:8080/geoserver/wms/reflect?layers=countries&srs=EPSG:54009

One final observation: unfortunately neither Ecker IV nor Molleweide have an official entry in the EPSG database.
In order to use them in GeoServer you'll have to edit your $GEOSERVER_DATA_DIR/user_projections/epgs.properties file and add the following two entries (mind, each definition has to be added as a single line, here we split them among multiple lines for readability sake):

54009=PROJCS["World_Mollweide",\
GEOGCS["WGS_1984",DATUM["WGS_1984",SPHEROID["WGS_1984",6378137.0,298.257223563]],
PRIMEM["Greenwich",0.0],UNIT["Degree",0.0174532925199433]],PROJECTION["Mollweide"],
PARAMETER["Central_Meridian",0.0],UNIT["Meter",1.0]]

54012=PROJCS["World_Eckert_IV",
GEOGCS["WGS_1984",DATUM["WGS_1984",SPHEROID["WGS_1984",6378137.0,298.257223563]],
PRIMEM["Greenwich",0.0],UNIT["Degree",0.0174532925199433]],PROJECTION["Eckert_IV"],
PARAMETER["Central_Meridian",0.0],UNIT["Meter",1.0]]
After that you can take your favorite world wide map and use the WMS reflector to get a quick map using the above projections.

These projections will be available in GeoServer 2.1 and GeoTools 2.7.
Interested in more map projections and datum shift improvements? Drop us a line!

The GeoSolutions team

Senin, 14 Februari 2011

Un nuovo anno con i Servizi di Supporto Enterprise di GeoSolutions

GeoSolutions è orgogliosa di offrire anche per il 2011 quattro piani di servizi enterprise incentrati sulla piattaforma GeoServer per aiutare i propri clienti a costruire una SDI (Spatial Data Infrastructure) di classe enterprise, attraverso l'integrazione e l'armonizzazione dei migliori framework geospaziali offerti dal mondo Open Source, la OpenSDI suite.


GeoSolutions grazie alla sua vasta esperienza nella costruzione e nel supporto di infrastrutture geospaziali di classe enterprise, fornirà alla vostra azienda uno straordinario livello di supporto durante tutto il ciclo di vita del progetto per ottenere con facilità un deployment ben riuscito!

Se la tua organizzazione era restia ad adottare soluzioni Open Source software per via della mancanza di supporto professionale, noi siamo qui per aiutarvi. E' arrivato il momento di investire in supporto e feature piuttosto che in licenze software.

Our support, Your Success!


Maggiori informazioni possono essere reperite qui. Ci potete contattare qui.

The GeoSolutions team

Jumat, 04 Februari 2011

Developers Corner: Improvements to the rendering engine on upcoming GeoServer 2.1/GeoTools 2.7

In this installment we are going to look into the rendering speed improvements featured in the the upcoming GeoServer 2.1/GeoTools 2.7.0 release.

We recently talked about a very significant one already: raster reprojection performance has skyrocketed, providing an overall speedup factor of four to six on the overall reprojected WMS request chain (if you want to know about the pure GeoTools reprojection operation speedup, it's more alike a hundred times faster).

What you might not know is that the above is coupled by another speedup that we made for the WMS shootout 2010: the "direct rendering path", which makes GeoServer into a proper image server.
What's the difference between a generic WMS server and a image server you might wonder? Well, a generic image server takes all the data sources and paints them on top of a rendering surface, applying styling as it goes. The rendering surface is commonly a blank RBG(A) image in memory on which features and rasters and combined.
Now, the thing is, if you are starting with a raster, you already have an image: there is no need to go through the generic rendering machinery, JAI can do all the required transformations directly and more efficiently than Java2D.
GeoServer 2.1 calls the above the "direct rendering path", and it's activated every time a WMS request contains a single raster layer: this gives another four-fold speedup at high load, and 20/50% speedup at the single user level.

The goodies embedded in GeoServer 2.1 do not stop here, significant improvements have been done in vector data rendering as well:
  • The renderer fetches vector data and renders it in two separate threads, allowing to distribute the request load among two cores
  • Large polygons are isolines are now clipped to the rendering area before being passed down to the Java2D rasterizer, greatly improving the performance on larger isoline layers and avoiding issues with one of the oldest unresolved java2D bugs which might bring a server to his knees when a large isoline or polygon is painted with a dash array and the user starts zooming in a lot (so that only a small part of the geometry is in the viewing area)
  • A special map is setup to track of very small geometries, this helps when rendering a very large amount of small objects at a low zoom level as it avoids painting over and over in the same pixel (this trick was available on 2.0.x as well, but only on shapefiles)
  • Shapefile indexing of very large data sets has improved significantly, making for smaller, but at the same time more selective, spatial index files. If you are upgrading from 2.0.x you should remove all your .qix files and let GeoServer rebuild them to take advantage of the improvements
We hope to setup a benchmarking session allowing us to get fresh comparisons between 2.0.2 and 2.1.0 once the release is done, possibly using the WMS 2010 shootout workload: stay tuned for more details on this one.

Of course there is still a lot that can be done to improve rendering performance. Do you have a specific case that you want to be improved? Interested? Let us know!


The GeoSolutions team

Rabu, 02 Februari 2011

GeoSolutions YouTube channel


Hi all,
at GeoSolutions we decided to create a YouTube channel in order to have common repository for the videos that we make sometimes to demonstrate and/or explain new functionalities for the software we develop.

You can reach the channel here.

Enjoy!
The GeoSolutions team.

Minggu, 23 Januari 2011

Developers Corner: have your SLD transform raster data into vectors on the fly

Hi all,
in this post we'd like to share our most recent endeavor in dynamic data rendering within the GeoServer and GeoTools open source projects.

The problem

Suppose you have a set of scientific raster data sets, maybe they represent some sort of concentration, elevation, or maybe they represent wind, currents, or some other vector phenomena via two bands (one for magnitude, one for direction).

Now, you have lots of them and people want to display them in various ways. Raster with color scales are nice, but often you need to render them in other ways, such as contour lines, polygons catching all the pixels within certain ranges, or vector fields (think wind barbs).
Those are all raster to vector conversion processes that a WPS can take care of. However, suppose you also have a ton of those raster data, and that the raster classification parameters need to be dynamic, with a user providing, for example, the contour levels to extract.

Now you're facing a somewhat hard problem, in theory you would have to:
  • call the WPS with the given data
  • store the results somewhere
  • register that new layer as a published WMS layer, along with the proper style
  • update the viewer to add that layer
  • purge that temporary layer once the user is done or wants a different set of parameters to be applied in the transformations
To add icing on the cake, suppose your datasets are massive, so doing the WPS extraction at full resolution can take its dear time.... does not really sound like a situation one would like your server and client infrastructure to deal with.

The solution

Instead of doing all of the above work, wouldn't it be nice to just specify the transformation needed in the style sheet? That's exactly the road we decided to follow.
We've created and SLD extension allowing to pipe a process (yes, a WPS one) inside the SLD so that it can be dinamically updated. It looks like the following:


The above would call on the fly the contouring process and then render its result: no need to create and manage a new vector layer, the data is generated on the fly only when needed.
Here is how the result looks (using a style sheet just a bit more complex than the above one):


Chaining transformations we can also extract and display the value of the single pixels and show it as a label, as in the following example:


Alternatively you may want to extract the polygons containing all the cells in a certain data range, like in the following transformation:


The result, coloring each range in a different way, is:


Finally, we may want to extract as set of wind arrows starting from a raster having the horizontal and vertical components of a vector (u and v):


We're linking to the full SLD of this last one because it's quite the testament of SLD flexibility: the magnitude and direction of the arrow are computed on the fly by using filter functions (functions that are part of GeoTools/GeoServer, you may not find them in just any implementation).

One important bit here is that the raster to vector conversion are happening at the visualization resolution: this means you can have the transformation work against large datasets without heavy slowdowns, because it is going to happen only in the area you're looking at, and at the resolution that would have been used to draw the raster.
This makes it possible to get fast, on the fly operations that do not excessively slow down rendering.

This is yet another example of how processing capabilities can be integrated into GeoServer, and it's by no means the last. Also, there is still plenty that can be done to improve this kind of transformations, as well as new transformations to support mapping tools such as heatmaps. Interested? Let us know!


The GeoSolutions team

Senin, 10 Januari 2011

Developers Corner: Improving GeoTools/GeoServer raster reprojection performance

Ciao a tutti,
we hope everybody had nice seasonal holidays and is back fresh and ready to move on with another year of activity.

In this blog we'd like to present some of the work we have been doing in recent time to improve GeoTools and GeoServer raster reprojection abilities.

Raster reprojection is a quite heavy process in which every single pixel of the original image has to be mapped into a new position in the target raster. Here is a visual representation of a small set of pixels, before and after the reprojection (in this case, from WGS84 to polar stereographic):

A point by point reprojection is obviously taking quite a toll, a screen sized image has easily well over one million pixels to reproject, much more than the number of vertices one can find in the common vector map. To make things worse, the transformation to be used often involves trigonometric functions and other complex mathematical tools that visibly slow down the calculation.

The reprojection algorithm used by GeoServer and GeoTools until now worked exactly like that, it used a very accurate but also very slow approach.

Now, if you think about it, the transformation applied to one pixel and the one applied to the next one are basically the same, the difference is going to be minimal.If we only had a small bunch of pixels we could compute a simple translation and apply it to them all.
Having more pixels we could try to approximate the overall transformation with a simple linear one, which in two dimensional space is known as an affine transformation.

If the area gets larger a single affine transformation would not be good enough anymore, but we could use many of them to fit different areas of the raster.

Have a look at the following one dimensional representation to get the gist of the idea (this is known as piecewise linear function):


The trick to apply this approach if finding out where and how much to subdivide the original area into discrete pieces that can use a single affine transform: to do so we devised a simple error estimation method that proved to work well with all common map projections.

So we start by evaluating the linear transformation error over the entire raster area, if it's larger than a certain target we split the area and evaluate again, and recurse this way until the approximation error has been put under control.

The optimized method proved to be quite effective, drastically reducing the time it takes to reproject a raster. We made some tests with GeoServer using the same data and the same reprojection test used in the FOSS4G 2010 WMS shootout measuring a six times speedup:


We also compared the images generated by the original and optimized method finding there was hardly any human noticeable difference, and very little difference that could be machine detected at all.

For all of you that want to dig into the nitty-gritty details, we have a full tech report that you can inspect.

There is still plenty that can be done to optimize further raster data reading and in memory transformations to reach even higher performance and scalability. Interested? Let us know!

The GeoSolutions team